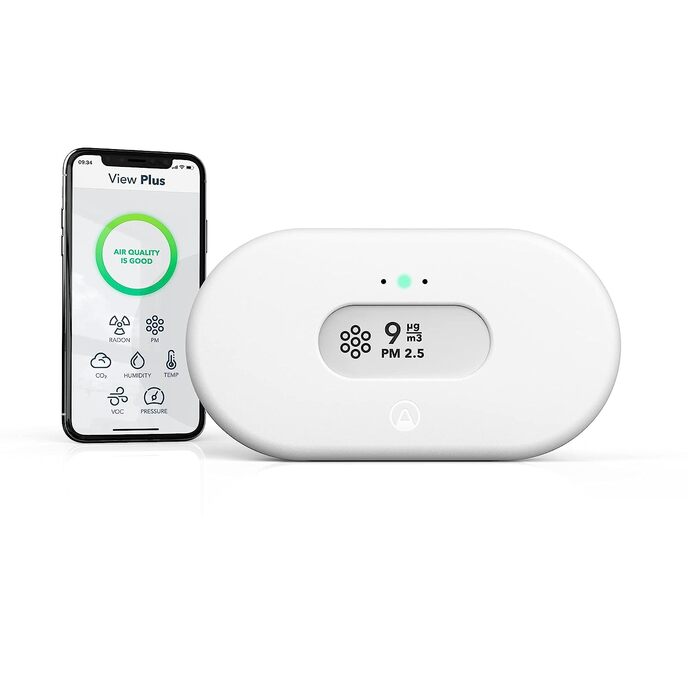
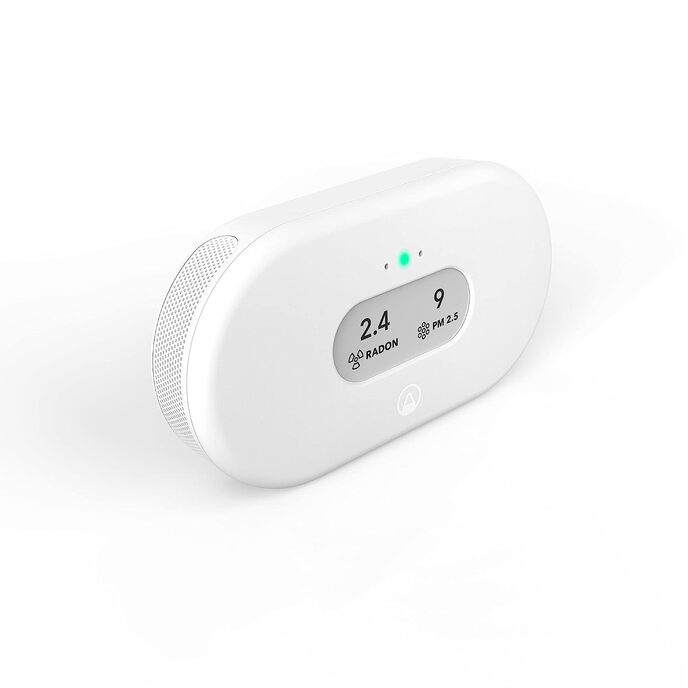
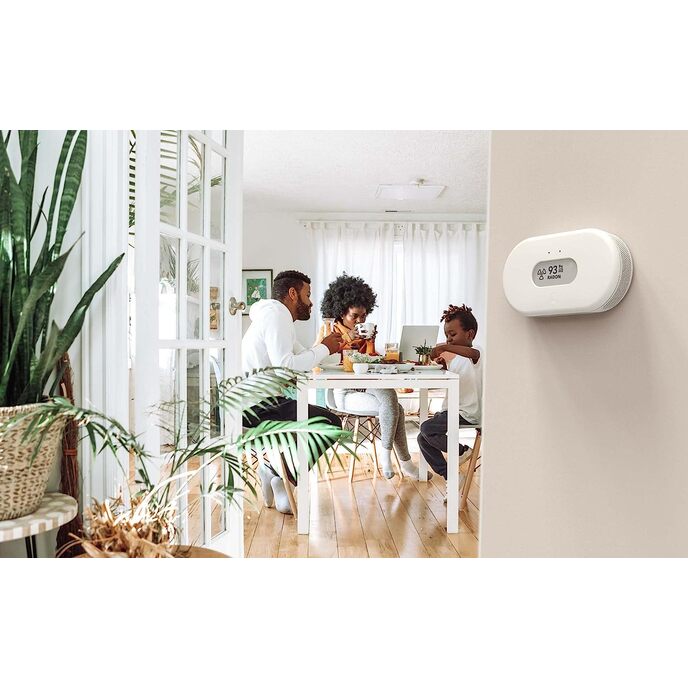
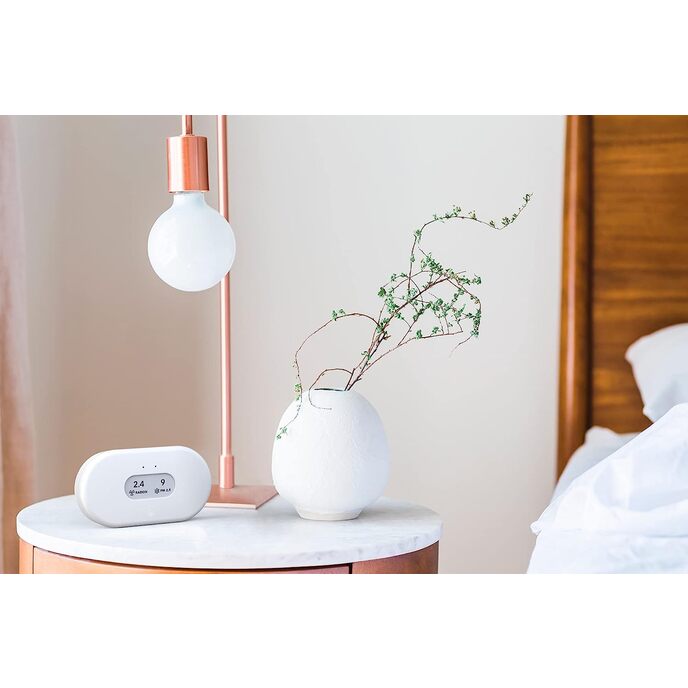
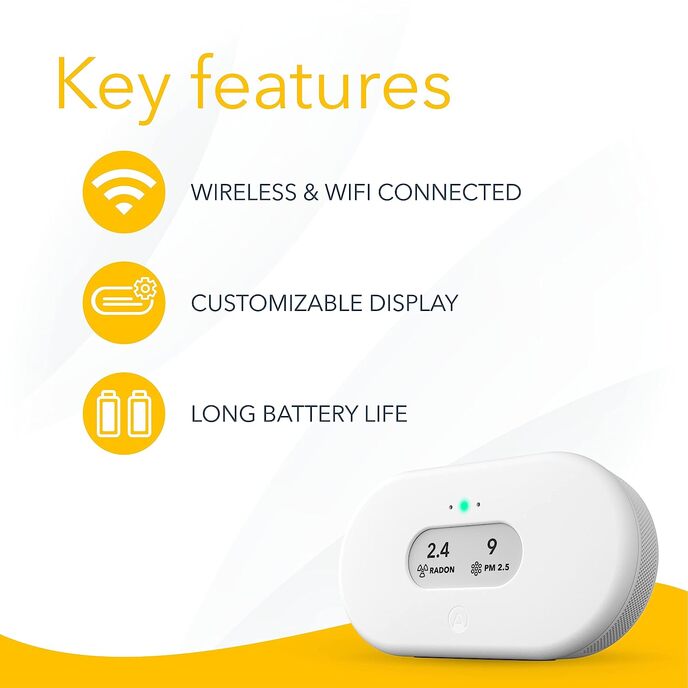
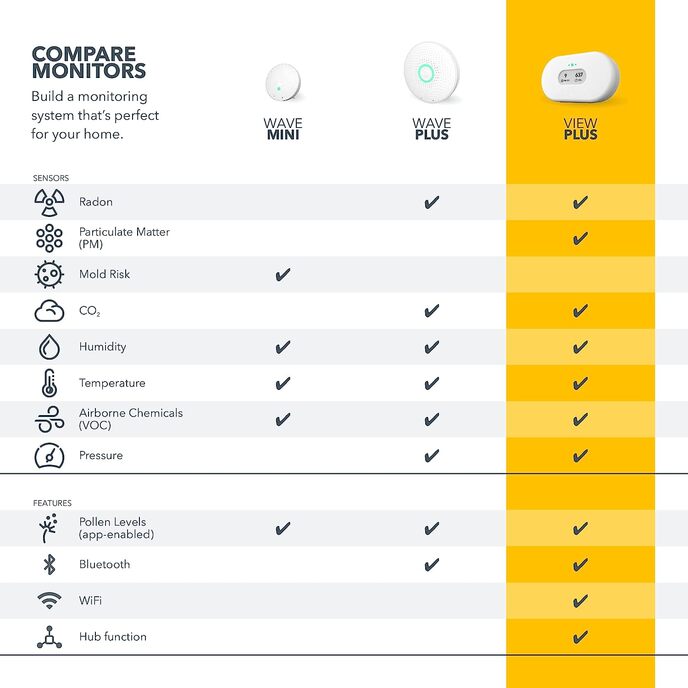
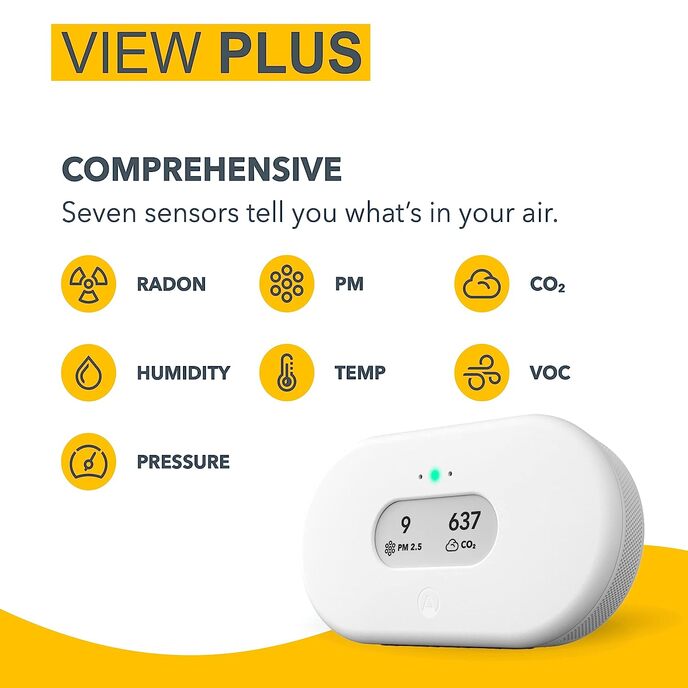
Tl:dr I recommend this product. I believe that it is currently the best on the market and provides a good array of sensors for the price. I have not received any financial or other consideration for this review. I have no connection to the company. Details, positive and negative, are found in the review. Intro: In operation (after 7-day calibration) for three weeks beginning October 2021. Unit is located indoors in the bedroom of a small single-story home in northern California. I purchased View Plus after an online evaluation of competitive units. The purchase decision was based on the array of sensors, acceptable display of sensor parameters, appearance of a good user interface, ability to easily download the data in Excel .csv file format, designed in Norway, and assembled in Tunisia (visible in product photos). I expect that this is the first product that I’ve ever owned that was assembled in Tunisia. There were no Amazon reviews as I purchased the unit as soon as it became available. My primary motivation for purchase was to measure indoor particulate pollution during the wildfires. I wanted a more quantitative measure than the colored indicators on our air purifiers. However, I have since become more interested in the carbon dioxide (CO2) and VOC levels. The inclusion of Radon, temperature, humidity, and atmospheric pressure sensors is a plus. Particulates: I have had an extended conversation with Airthings via the app. They are responsive, although it may take a few days or even a week, if you ask technical questions as these need to go to the engineering team. As this is a consumer and not scientific device, there are cost limits on the nature of the particle sensor. Airthings does calibrate the particulate sensor to a scientific instrument. However, the Airthings sensor is most likely not able to distinguish between different particle size and scattering distributions that give the same overall signal. I had plans to do a cross correlation study with a scientific instrument, but circumstances conspired against me. At this time, I am satisfied that Airthings has done enough work that the threshold limits (green <10, yellow <25, and red >25 µg/m3) for the PM 2.5 sensor are reasonably close to the equivalent limits used by the US EPA and European PM 2.5 AQI. For the data that I’ve collected, there is very little difference between PM 2.5 and PM 1 signals. I have not investigated why. One caveat is that the data collected so far has an average PM 2.5 and PM 1 values of only 2 µg/m3 and only a single peak greater than 25. Since the rains have (finally) come, I don’t expect to have the opportunity to check against more polluted air conditions in the near term. Carbon dioxide: This provided the most surprise about the conditions in our home. I found that ventilation in our bedroom is insufficient to keep levels in the green without the window(s) being open at night. I am looking into ways to ameliorate this problem when keeping the windows open is not an option. When I first received the unit, I placed it outdoors to see if it would read the expected value of about 400+ ppm for average CO2. The unit read about 550, but it was before the 7-day calibration was completed. Over the course of the past month, when the room was well ventilated, I observed readings as low as 469 ppm. The unit will show the increase in CO2 when either 1 or 2 people are in the unventilated room for any significant period of time. VOC (volatile organic compounds): The measurement is in parts per billion, ppb. This is my first experience with VOC data recording. The unit is certainly responsive and exhibits significant signal when we are cooking, especially frying. As there are many different types of VOC, I cannot comment on whether one should take significant actions based on the results in the home. Do fry-cooks have career related health issues? At a work environment, such as an organic chemistry lab, there may be many types of VOCs that are clearly harmful to health. Radon: All the values that I have recorded are below the green threshold limit of 2.7 pCi/L (picocuries per liter). The average value over 2000 measurements is 0.7 and has a standard deviation of ±0.4. Temperature: Comparing the value to household sensors indicates that the temperature displayed by the Airthings sensor maybe between 1- or 2-degrees F high. However, I consider that within measurement error for accuracy given the nature of the other sensors. Precision appears to be excellent. Relative Humidity: Comparison only with household sensors. Appears to be within a few percent. Atmospheric Pressure: Excellent agreement (within 0.5 mBar) with external values (local weather data). Range of data recorded between 1001 mBar and 1022.5 mBar. User Interface (Unit): There is an E-Ink type display that is not illuminated. This is a very low power display and conserves battery. No power used to maintain the current display reading. It has high contrast and easy readability. You can choose 2 sensors to display via the app (Phone or PC). When you wave your hand in front of the unit, it indicates its assessment of the overall air quality (good, fair, or poor) and shows any of the readings that cause a fair or poor result. It then returns to the standard readout. I have not found the lack of illumination to be detrimental. User Interface (Phone): I’m using a Samsung Galaxy A51 with Android 11. The software allows you to choose among several devices that you might have. As I have only one, it displays a summary that is in the attached photo. You can then tap “VIEW IN WEB DASHBOARD” to get graphic displays for different periods of time. You can choose to get notifications via the app, if values exceed the Airthings recommended thresholds. You can choose the sensors for which to have notifications sent. These thresholds cannot be changed. I think it would be good to be able to change the thresholds with the understanding that one is responsible for the values used. User Interface (PC/Web): I’m using an Intel-based PC running Windows 10 Pro and MS Edge for this unit. See attached photo. The graphing is generally quite good. I’d prefer to be able to choose the order in which the different sensors are displayed. It might be possible to do this by deleting sensor graphs (called tiles) and then adding them back. I’ve not tried that. The vertical scaling is automated and determined by the range of values of the data being displayed. The scale cannot be changed, but you can zoom using touch, if your computer/phone has that capability. Adding the historical data (not shown in the photo) will expand the vertical size of each graph and give the minimum and maximum value for the data range. Bug: You can add a tile for the outdoor weather, but only for Oslo, Norway! They have given me instructions for changing the location, but the software for the View Plus is not the same as for the software shown in the instructions. I have made them aware of this. It is unclear to me whether they can and will offer software updates. Downloading Data: The .csv file contains the time and sensor data for the entire time the system has been recording for that location. If I don’t do something to re-start history, the data file will eventually grow to unmanageable size. They should allow you to specify the range or use the range chosen for the graphing display. The file name is also fixed as the serial number of the unit. These are serious limitations given the extra work caused for the user, I consider them bugs. The data are separated by semi-colons, so converting from text to columns in MS Excel is easy. The data are recorded with a UTC time stamp. Since I’m in California, it is easy enough to subtract 7 hours and put the local time in the next column. The headers have a few character-conversion bugs: “μ” instead of “µ.” The character “” is inserted in the Temperature column header. These are minor. The date/time format is 2